How to Make(Or Lose) Money in Stocks Part1
Tags: stocks python finance money google selenium
Recently I finished watching web-series Scam 1992. It's based on story of Harshad Mehta, a famous Indian stockbrocker who made fortunes in stocks. Despite his iconic success & failure, the series rekindled my interest in world of "stocks". I guess the famous dialogue "Risk Hai Toh Ishq Hai" has stuck with me.
I still consider myself a novice when it comes to stocks. There's a no magic bullet to make money in stocks. However you can leverage scripts to reduce time to accumulate information. I'll share one such approach in helping you to buy or sell stocks.
Lets say you want to buy or sell some stocks. You can use some website to track them everyday (too tedious). Or you can use some API (like yahoofinance) to get this information. However free API usually have some time lag. We will using python in getting our current stock prices directly from google.
Setup before you begin
Open your favourite terminal to create directory
$ mkdir $stocks
$ cd $_
We will be using poetry to manage our library depedencies. Create a default pyproject.toml file like this
$ poetry init
Keep pressing enter to keep the defualt configuration
Next we will create a text file, stocks.csv. This will list all the stocks that we need to track. For this example I am using aaple and microsoft.
ticker,sell,sell,buy
aapl,0,125,0,0
msft,0,0,230,0
Here let me briefly expalin the columns:
-
ticker : stock ticker symbol
-
sell: the price at which you want to sell stock
-
buy: the price at which you want to buy stock
"Investing should be more like watching paint dry or watching grass grow. If you want excitement, take $800 and go to Las Vegas." - Paul Samuelson
Next create python file, stocks/main.py
import pandas as pd
from io import BytesIO
from reportlab.platypus import SimpleDocTemplate, Paragraph, PageBreak
from reportlab.lib.styles import getSampleStyleSheet, ParagraphStyle
from reportlab.lib.units import mm
from reportlab.lib.pagesizes import letter
from reportlab.platypus.tables import Table, TableStyle
from reportlab.lib import colors
from reportlab import platypus
from  reportlab.lib.styles import ParagraphStyle as PS
from selenium import webdriver
from selenium.webdriver.common.keys import Keys
from selenium.webdriver.chrome.options import Options
from selenium.webdriver.common.action_chains import ActionChains
from reportlab.platypus import Image as Image2
import logging
Next we will open our favourite Web browser to type aapl stocks
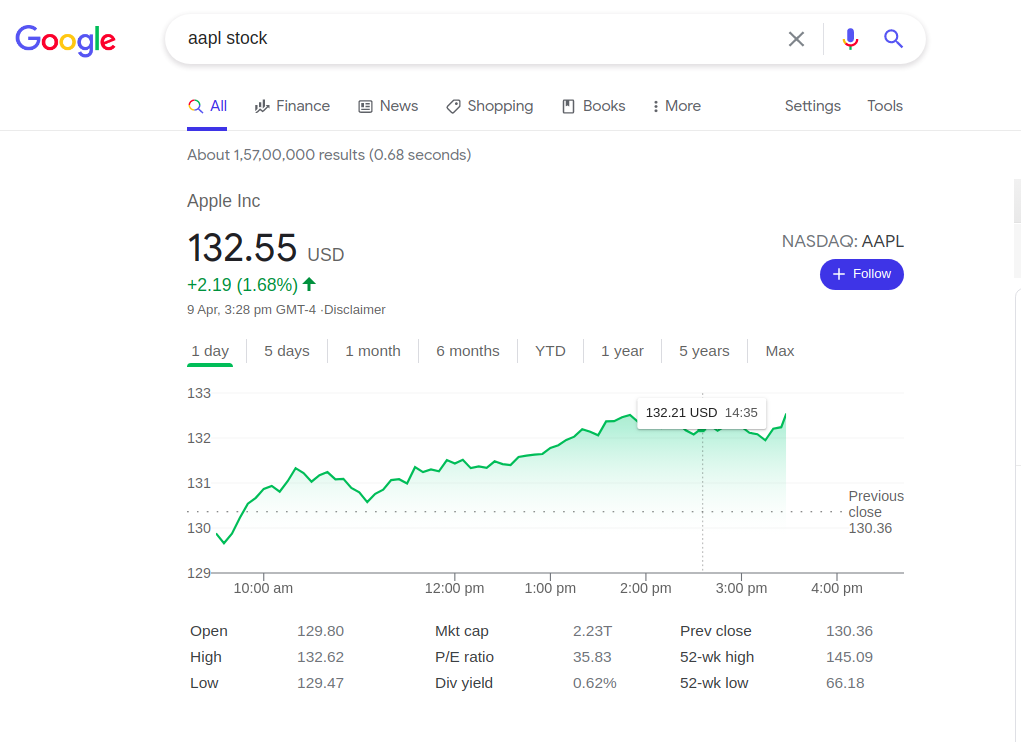 |
We will then right click and use inspect the web page
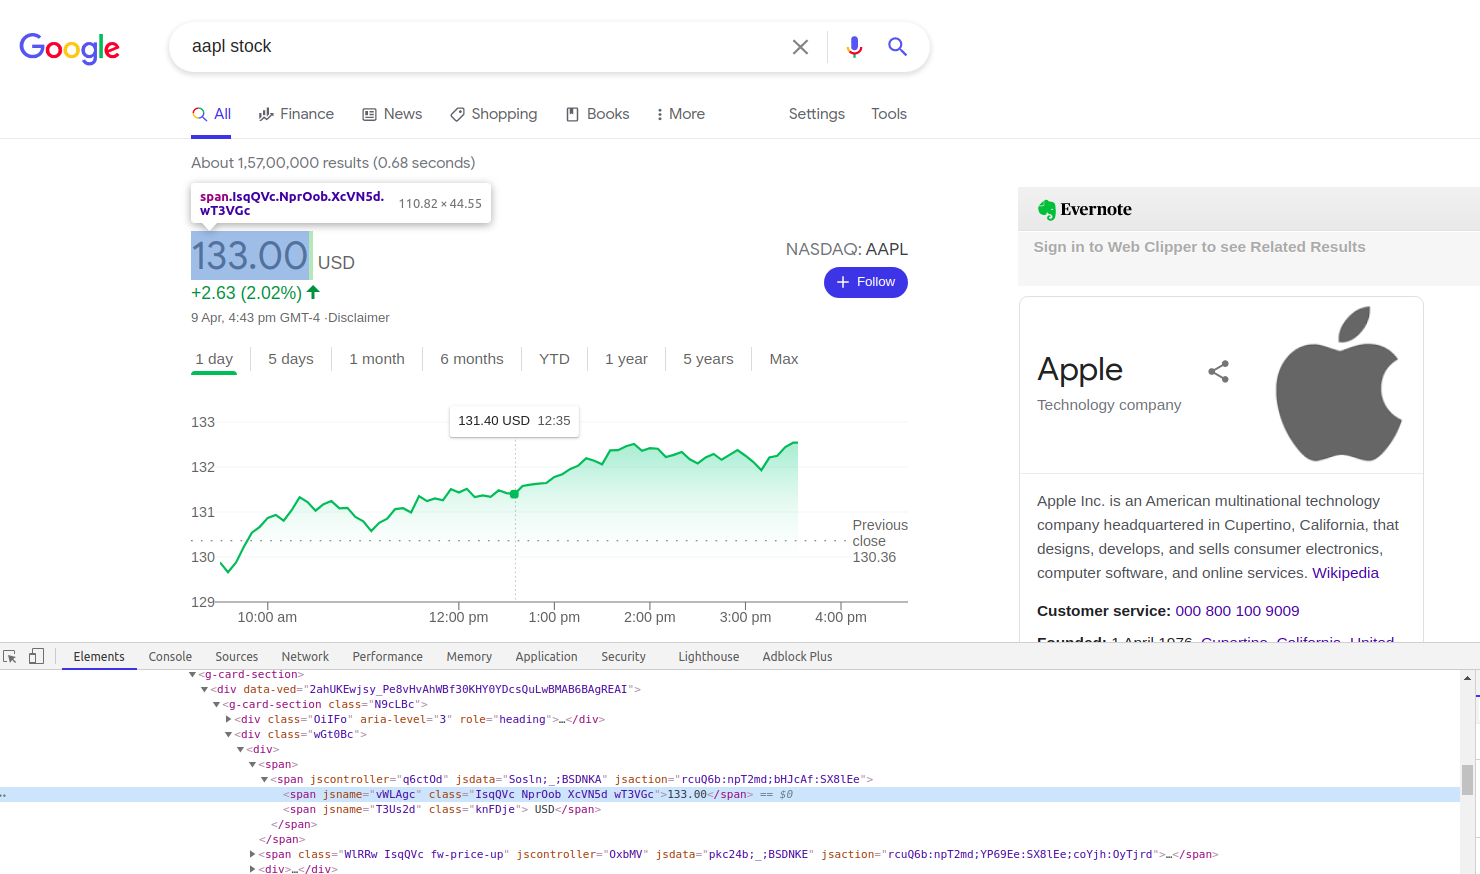 |
Here we are looking for jsname with value vWLAgc
So our algorithm is like this for every stock
-
get current price of stock
-
Prints if the current price is greater than my desired selling price
-
Prints if the current price is smaller then my desired buying prices
I'll be using reportlab library to generate pdf for my output.
Run this command using
$ poetry run python stock/main.py
The output looks like this
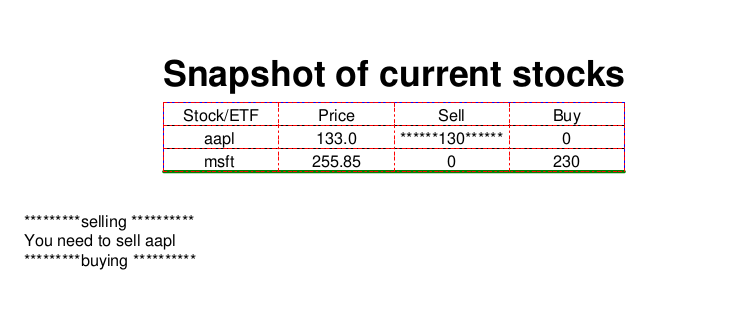 |
Of course predicting the buying and selling prices is an uphill task. May be you can call up Warren Buffett for tips. But I can't since he doesn't pick up my call 😢. So in next tutorial we'll do some technical analysis on stocks.
comments powered by Disqus