Meetup at McColl School of Business at Queens University
Tags: charlotte finance python
I went to Charlotte Fintech Meetup. It was held in Room 326 of Sykes Hall, which is located in the McColl School of Business at Queens University.
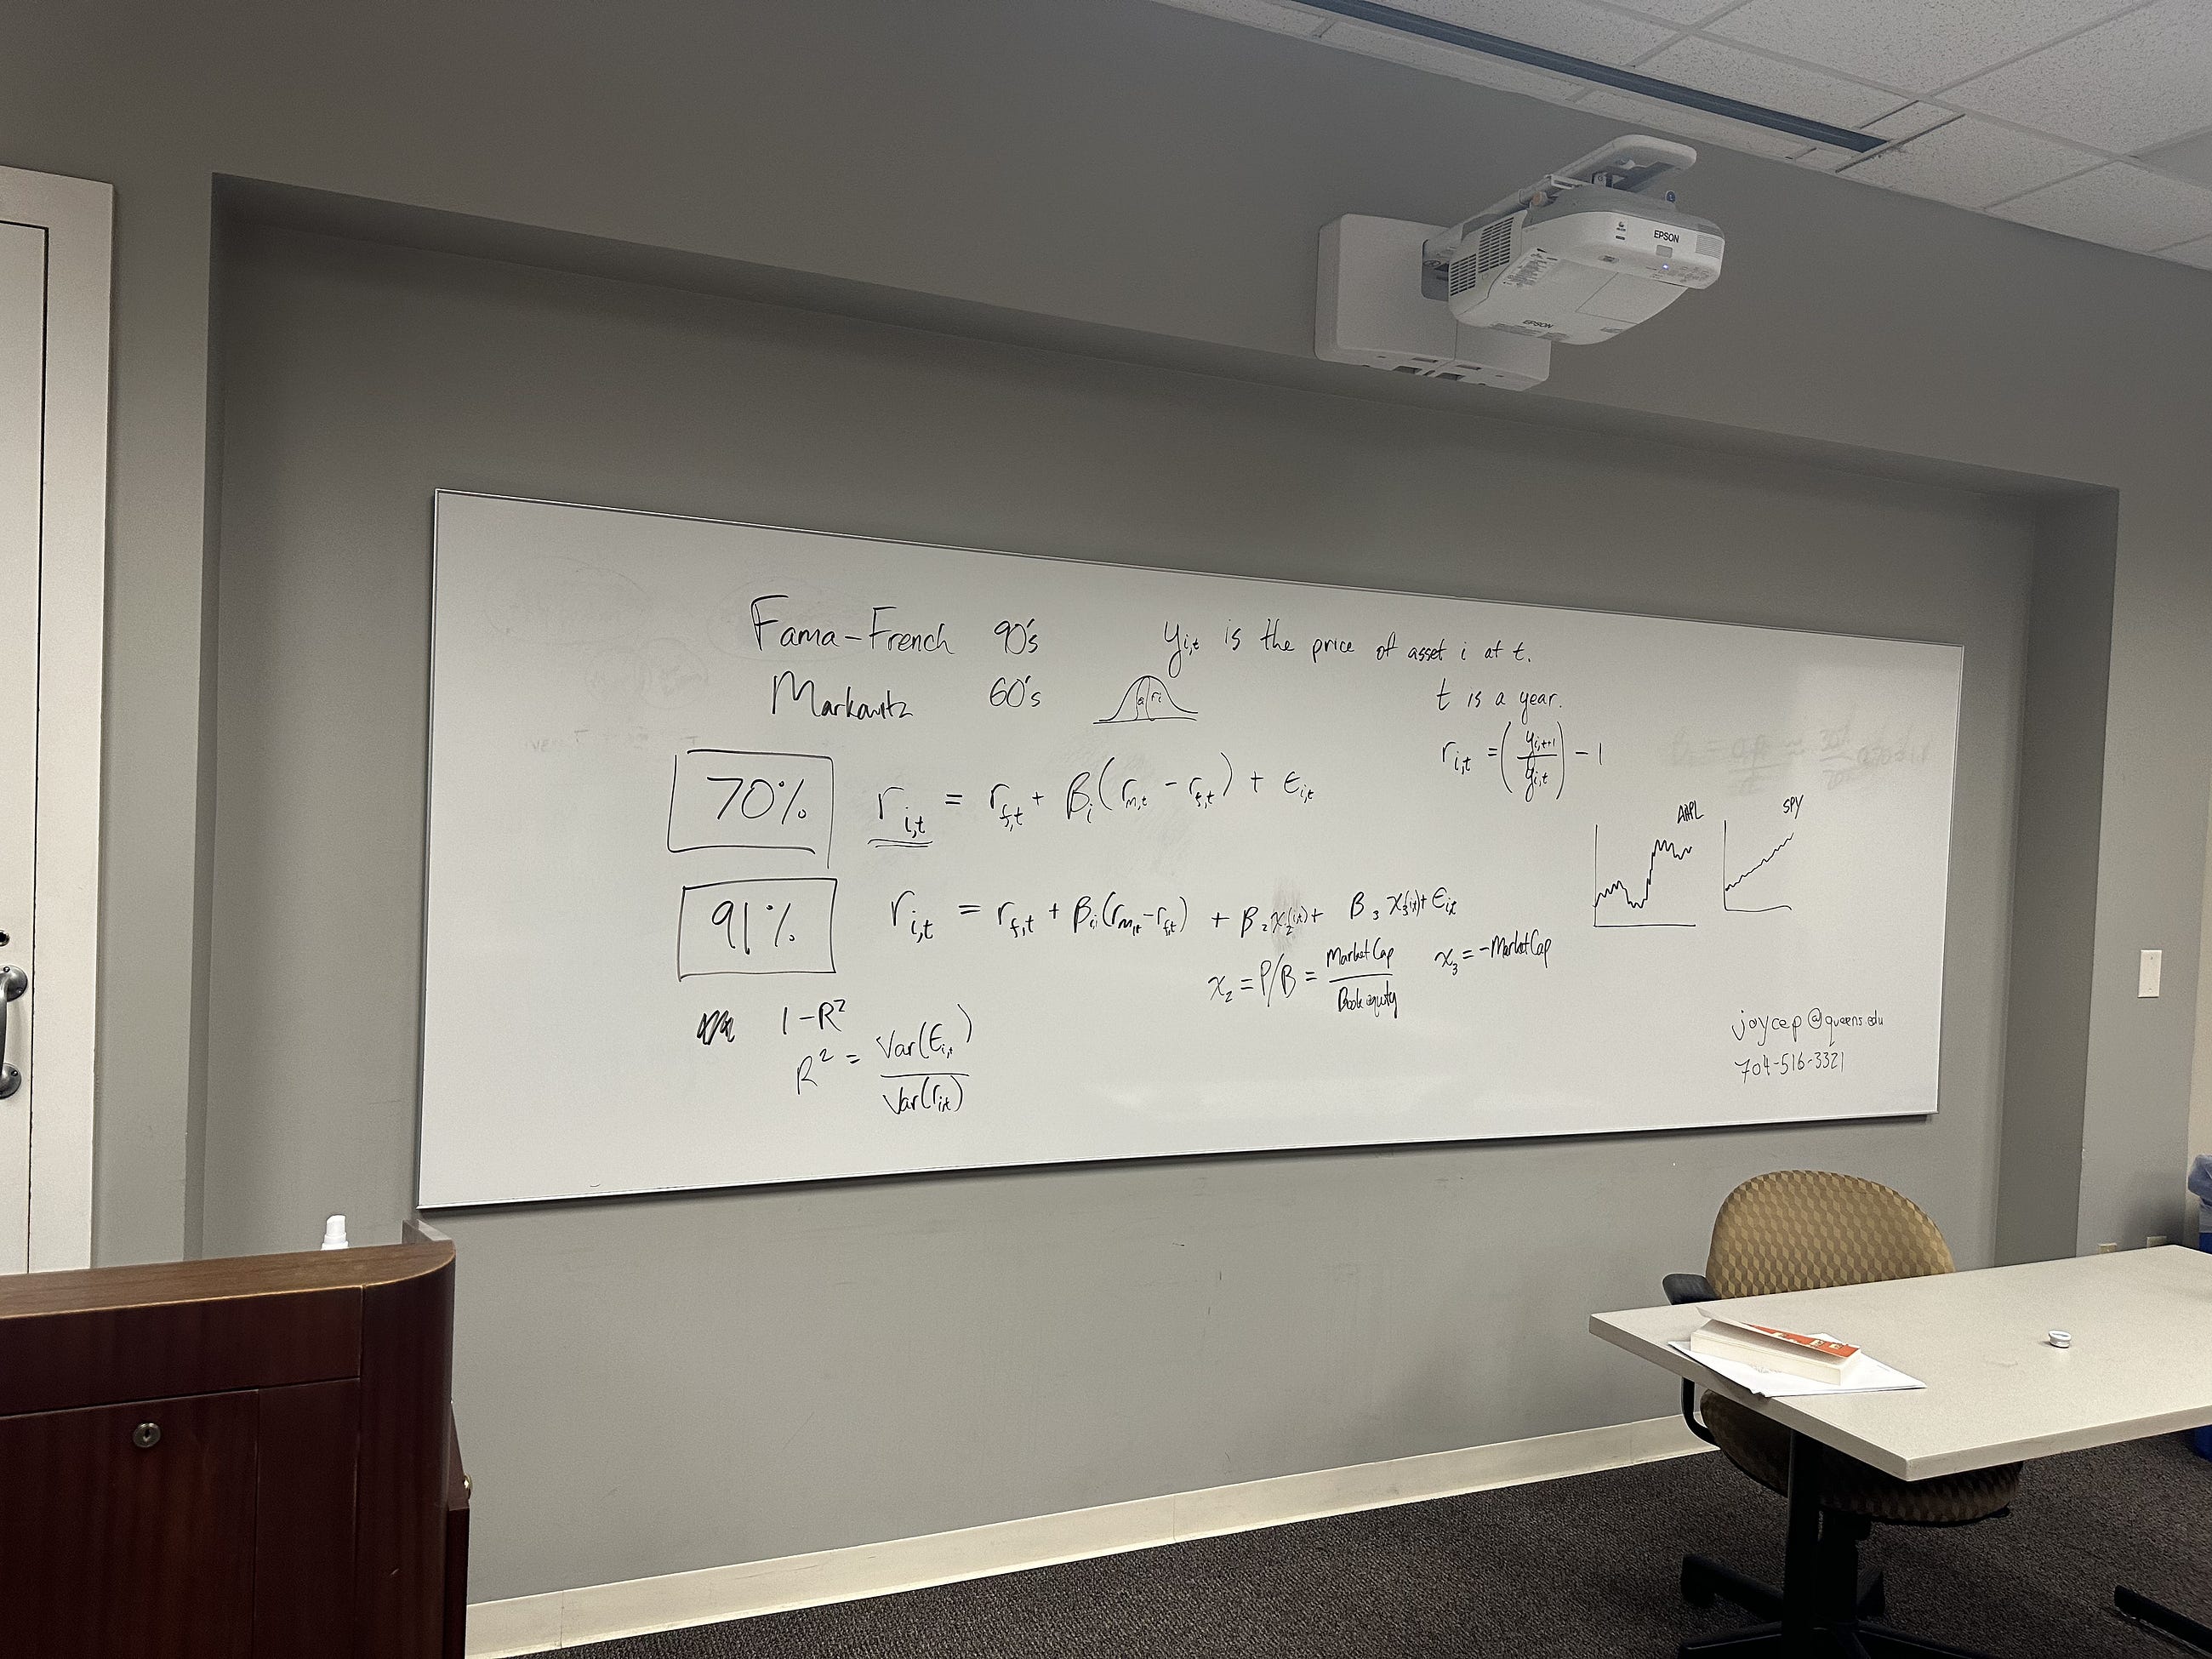 |
Fama-French Three-Factor Model
The Fama-French Model is an expansion of the Capital Asset Pricing Model (CAPM). It adds two additional factors to the market risk factor in CAPM. The model is often used to explain the performance of stock portfolios by examining how portfolios with different characteristics perform relative to risk factors. If a portfolio consistently invests in a small-cap or value stocks, it may have a positive SMB or HML factor, indicating that it's positioned to potentially benefit from the higher returns associated with these factors.
Size Factor (SMB: Small Minus Big)
SMB stands for "Small Minus Big" and is one of the three factors in the Fama-Fench three-factor model. It represents the excess return of small-cap stocks over large-cap stocks.
The idea behind SMB is that small-cap stocks (with a small market capitalization) tends to have higher risk and potentially higher return to compensate for that risk. Over time, historically, small cap stocks have outperformed large-cap stocks on average.
Value Factor (HML: High Minus Low)
HML stands for "High Minus Low" and represents the excess retrun of value stock (with high book-to-market ratios) over growth stocks (with low book to market ratios).
Value stocks are typically companies that are considered undervalued relative to their fundamental value as indicated by their financial statements. Growth stocks are companies that might not be undervalued but are expected to grow at an above-average rate compared to other companies. Historically, value stocks have outperformed growth stocks, which is what HML seek to capture.
Markowitz Modern Portfolio Theory (MPT)
Developed by Harry Markowitz in the 1950s, MPT is a framework for assembling a portfolio of assets such that the expected return is maximized for a given level of risk. It relies on diversification to reduce the risk.
Return of a Financial Asset (R)
The return of an asset from time t-1 to t is calculated as:
Return (R) = (Price at time t / Price at time t-1) - 1
This formula gives us the percentage change in the asset's price.
Time Periods
In financial analysis, time periods are crucial. They can be days, months, years, or any other interval used to measure performance.
R-squared (R^2)
R-squared is a statistical measure in a regression model that determines the proportion of the variance in the dependent variable that is predictable from the independent variable(s).
Formula: R^2 = 1 - (Unexplained Variance / Total Variance)
Beta Coefficients (β)
Beta is a measure of the volatility, or systematic risk, of a security or a portfolio in comparison to the market as a whole. It is used in the CAPM.
Formula: β = Covariance(Return of Asset, Return of Market) / Variance(Return of Market)
Example in Python
Interpretation of the output
The beta of AAPL is 1.2175729053938895
The R-squared value is 0.6075157876617264
The beta of a stock measures its volatility relative to the market. A beta of 1.22 suggests that Apple's stock is 22% more volatile than the market. If the market goes up by 1%, Apple's stock is expected to go up by 1.22% and vice versa. This implies a higher level of risk compared to the market, but also the potential for higher returns.
Trading Implication: As a trader, if you expect the market to rise, holding AAPL could yield better returns compared to a less volatile stock (with lower beta). Conversely, if the market falls, AAPL could potentially fall more. If you are averse to risk or if the market is expected to be bearish, you might consider diversifying your portfolio or looking into stocks with a lower beta.
R-squared values range from 0 to 1 and measure how closely the stock's price movements are related to the movements of the market index. An R-squared of 0.61 means that approximately 61% of the stock's price movements can be explained by changes in the S&P 500 index. The remaining 39% of price movements are influenced by factors specific to Apple or its industry.
Trading Implication: An R-squared of 0.61 indicates a moderate-to-high correlation with the market. For traders, this means that while Apple does follow the market to a significant extent, there's still a considerable portion of its price movement that is due to company or industry-specific factors. Hence, it's important to pay attention to Apple's own news, financial reports, and industry trends, in addition to overall market sentiment. What This Means for Trading When trading a stock like AAPL with a beta higher than 1 and a moderately high R-squared:
-
In a bullish market, AAPL may provide higher returns than the market average.
-
In a bearish market, AAPL may see larger losses than the market average.
-
While AAPL moves with the market to a degree, individual factors are also at play, so it's not solely tied to market movements.
comments powered by Disqus